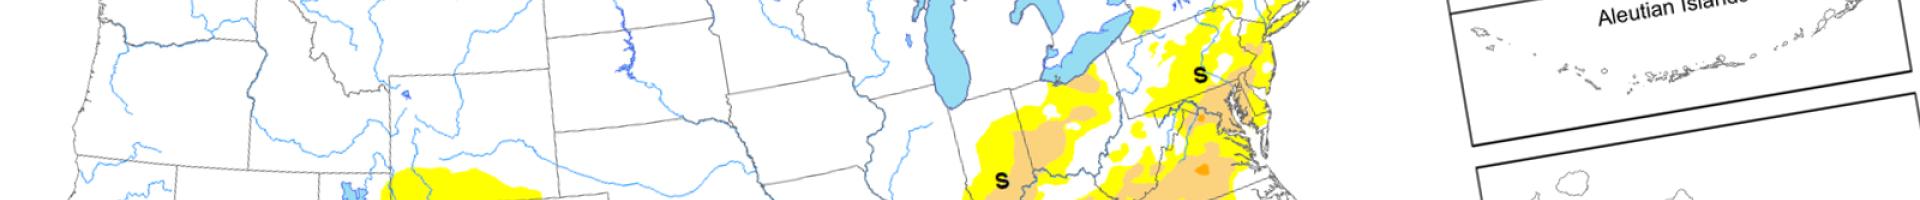
Image
Tool

U.S. Drought Monitor

Description

The U.S. Drought Monitor is a map released every Thursday showing parts of the U.S. and its territories that are in drought. The map uses five classifications: abnormally dry (D0), showing areas that may be going into or are coming out of drought, and four levels of drought ranging from moderate (D1), severe (D2), extreme (D3), to exceptional (D4).

The Drought Monitor is produced jointly by the National Drought Mitigation Center (NDMC) at the University of Nebraska-Lincoln, the National Oceanic and Atmospheric Administration (NOAA), and the U.S. Department of Agriculture (USDA). The NDMC hosts the website of the drought monitor and the associated data, and provides the map and data to NOAA, USDA, and other agencies.

The USDA uses the drought monitor to trigger disaster declarations and eligibility for low-interest loans. The Farm Service Agency uses it to help determine eligibility for their Livestock Forage Program, and the Internal Revenue Service uses it for tax deferral on forced livestock sales due to drought. State, local, tribal, and basin-level decision makers use it to trigger drought responses, ideally along with other more local indicators of drought.


Related Case Studies & Action Plans

Image
  • Sub-sample of image: 2007 drought at Lake Lanier, by Tom Wilson.

  • Image
  • Still image of an aqueduct canal near Salinas, Puerto Rico, extracted from the FEMA video "Recharge Project: Aquifer Storage and Recovery Project in Salinas, Puerto Rico"

  • Image
  • Confluence of the Ruby and Beaverhead rivers, just south of Twin Bridges, Montana. Public domain photo by Mike Cline

  • Image
  • Drought on Ailuk Atoll in 2013, Republic of the Marshall Islands. Unmodified photo by PACC, CC BY-NC-ND 2.0, https://creativecommons.org/licenses/by-nc-nd/2.0/, via Flickr