Image

Tool
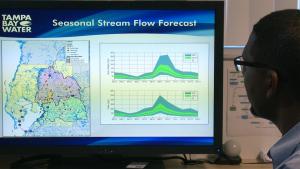
U.S. Climate Outlooks
Unlike traditional weather forecasts that predict daily temperatures and precipitation amounts for an area, climate outlooks indicate how confident forecasters are that upcoming temperature and precipitation conditions will be above or below what's normal for their region over the period of the outlook.
Outlooks are color-coded maps that indicate categories of forecast conditions, relative to their average norms. Shaded areas indicate the probabilities for above- or below-average conditions, with darker colors indicating a higher likelihood for the forecast category.
Learn more about climate outlooks and how to understand them in the Climate.gov article, Understanding NOAA’s monthly and seasonal climate outlooks.