Skip to main content
Main navigation
Case Studies
Mega Menu Icon
Image
Browse Case Studies
Filtered by hazard
Drought
Extreme Heat
Coastal Flooding
Flooding
Wildfire
Filtered by asset
Agriculture
Community Services
Critical Facilities
Economy
Energy
People
Property
Natural Areas
Transportation
Water Infrastructure
Tools
Mega Menu Icon
Image
Browse Tools
Filtered by hazard
Drought
Extreme Heat
Coastal Flooding
Flooding
Wildfire
Filtered by asset
Agriculture
Community Services
Critical Facilities
Economy
Energy
People
Property
Natural Areas
Transportation
Water Infrastructure
Funding
Mega Menu Icon
Image
Browse Funding & Capacity
Funding & Building Capacity
Search for Funding Opportunities
Grant Development Resources
Steps to Resilience
Overview
Get Started
Understand Exposure
Assess Vulnerability & Risk
Investigate Options
Prioritize & Plan
Take Action
Contents
Mega Menu Icon
Image
Browse Popular Resources
Announcements
Steps to Resilience
Help Desk
Glossary
Contact
Case Studies
Tools
Trainings
Options Database
Organizations
New to the Toolkit?
Topics & Sectors
Regions
Hazards
Assets
Submit
Breadcrumb
Home
Image
Synthesis of Adaptation Options for Coastal Areas
Image
Rolling Easements Primer
Image
Planning Framework for a Climate-Resilient Economy
Image
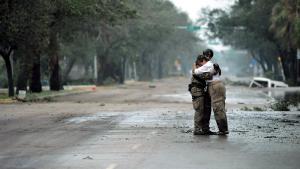
Staff Sgt. James L. Harper Jr., U.S. Air Force photo. Public domain, via Wikimedia Commons
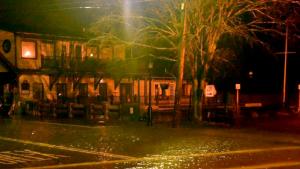
A Climate for Resilience
Image
Fisheries Resilience Index
Image
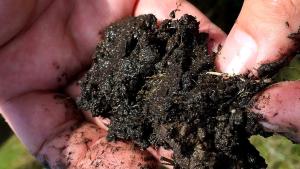
Coastal Blue Carbon Manual
Image
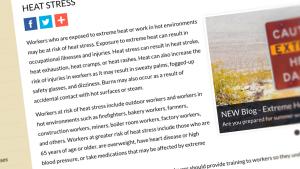
Heat Stress Toolkit
Image
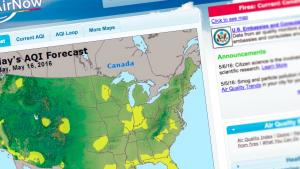
AirNow: Air Quality Index (AQI) Monitoring and Forecasts
Image
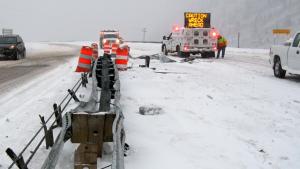
Weather Safety Resources for All Hazards
Image
Heat Safety Tips and Resources
Pagination
First page
« First
Previous page
‹ Previous
…
Page
76
Page
77
Page
78
Page
79
Current page
80
Page
81
Page
82
Page
83
Page
84
…
Next page
Next ›
Last page
Last »
Subscribe to
Image Credits