Home
Main navigation
  • Case Studies
    Mega Menu Icon
    Image
    case study icon
    Browse Case Studies
    • Filtered by hazard
      • Drought
      • Extreme Heat
      • Coastal Flooding
      • Flooding
      • Wildfire
    • Filtered by asset
      • Agriculture
      • Community Services
      • Critical Facilities
      • Economy
      • Energy
      • People
      • Property
      • Natural Areas
      • Transportation
      • Water Infrastructure
  • Tools
    Mega Menu Icon
    Image
    data and tools icon
    Browse Tools
    • Filtered by hazard
      • Drought
      • Extreme Heat
      • Coastal Flooding
      • Flooding
      • Wildfire
    • Filtered by asset
      • Agriculture
      • Community Services
      • Critical Facilities
      • Economy
      • Energy
      • People
      • Property
      • Natural Areas
      • Transportation
      • Water Infrastructure
  • Funding
    Mega Menu Icon
    Image
    funding icon
    Browse Funding & Capacity
    • Funding & Building Capacity
    • Search for Funding Opportunities
    • Grant Development Resources
  • Steps to Resilience
    • Overview
    • Get Started
    • Understand Exposure
    • Assess Vulnerability & Risk
    • Investigate Options
    • Prioritize & Plan
    • Take Action
  • Toolkit Contents
    Mega Menu Icon
    Image
    popular resources icon
    Browse Popular Resources
    • Announcements
    • About this Toolkit
    • Steps to Resilience
    • Glossary
    • Contact
    • Tools
    • Help Desk
    • Trainings
    • Options Database
    • New to the Toolkit?
    • Topics & Sectors
    • Regions
    • Hazards
    • Assets

Breadcrumb

  1. Home
Image
NJ Flood Mapper
Image
  • Agiorgio. CC-BY-SA-3.0, http://creativecommons.org/licenses/by-sa/3.0/legalcode, via Wikimedia Commons

  • Training Sessions Build Capacity for Recovery and Planning
    Image
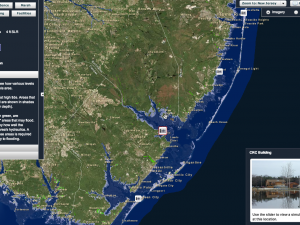
    Inundation Mapping Interface
    Image
  • Animum, own work. GFDL (http://www.gnu.org/copyleft/fdl.html) or CC-BY-SA-3.0-2.5-2.0-1.0 (http://creativecommons.org/licenses/by-sa/3.0)], via Wikimedia Commons

  • Minimizing the Impacts of Coastal Flooding Helps City Prepare for Sea Level Rise
    Image
  • Still image from video "Expanding on the Almanac." Video footage: Kurt Mann

  • Climate Outlooks Increase Farmer's Odds for Success
    Image
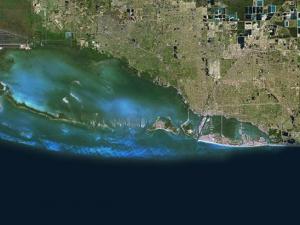
    Coastal Resilience Apps
    Image
  • Todd R. Emmerson. CC-BY-SA-3.0, http://creativecommons.org/licenses/by-sa/3.0/legalcode, via Wikimedia Commons

  • Climate Preparedness Workshops Provide a Head Start Toward Resilience
    Image
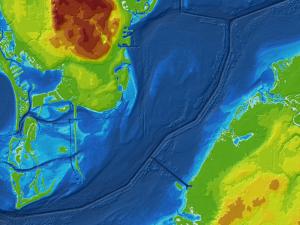
    Vdatum
    Image
  • Imagery © 2014 Google, Data SIO, NOAA, U.S. Navy, NGA, GEBCO, Map data ©2014 Google
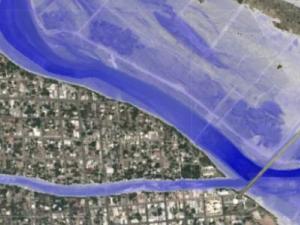
  • Collaboration Among Counties Improves Regional Vulnerability Assessments

    Extreme Heat

    Unusually hot summer days and nights have become more common across the contiguous United States over the last few decades.

    Pagination

    • First page « First
    • Previous page ‹ Previous
    • …
    • Page 99
    • Page 100
    • Page 101
    • Page 102
    • Current page 103
    • Page 104
    • Page 105
    • Page 106
    • Page 107
    • Next page Next ›
    • Last page Last »
    Subscribe to
    Climate.gov
    • Home
    • News & Features
    • Teaching Climate
    • Maps & Data
    • FAQs
    • Contact
    Main Menu
    • About
    • FAQ
    • Contact
    • Acknowledgments
    • Sitemap
    Latest
    • Funding Opportunities
    • Glossary
    • Announcements
    Partners
    • climate.data.gov
    • climate.gov
    • USA.gov
    • NEMAC
    Toolkit
    • Case Studies
    • Tools
    • Funding
    • Steps to Resilience
    • Popular Resources

    Image removed.

    Required Footer Links
    • NOAA Privacy
    • Accessibility
    • FOIA
    • Information Quality
    • No-FEAR Act
    • Ready.gov
    • USA.gov