Image

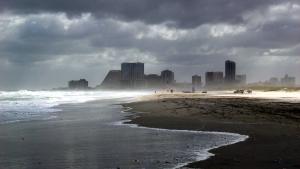
Public domain image from Wikimedia Commons
Image
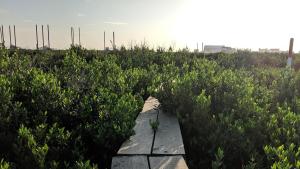
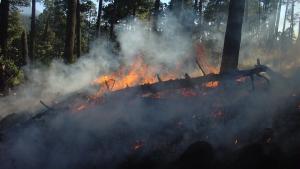
Splash screen for NFWF Case Study: The Water Institute of the Gulf — Port Fourchon: Supporting Resiliency on an Evolving Coast
Image
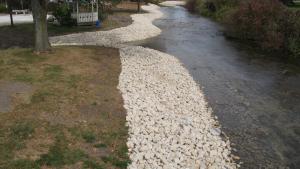
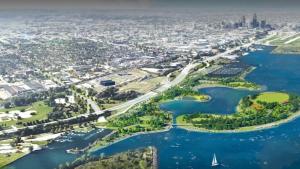
Splash screen for NFWF Rhode Island Case Study
Image

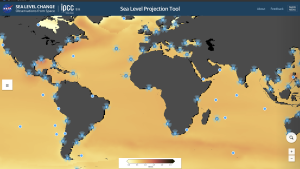
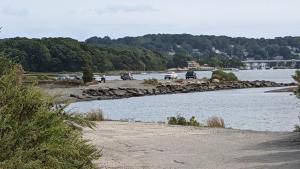
Splash screen from NFWF North Carolina Department of Environmental Quality Case Study.
Image

Splash screen from NFWF Case Study